This example shows a more advanced bioreactor model where both intracellular and extracellular concentrations are considered. For an introduction to the basics of bioreactor modeling in REX, you may find this simpler BioReactor example more useful.
We model the production of Xylitol from Xylose by the yeast Candida Mogii in a batch reactor. This model is fully based on the work of Tochampa et al. [ Ref 1].
Xylose available in the liquid solution is taken up by Candida Mogii yeast, where it is reduced to Xylitol. Part of the Xylitol is excreted by the cell, and the rest is used to generate cell mass. Glucose in the solution medium helps to increase the xylitol yield, as the glucose pathway to cell mass is a more direct way than xylitol to generate energy and biomass.
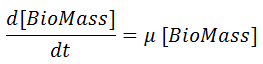
The biomass growth rate is given by:
Where [ BioMass] is the biomass concentration (g/l) and μ is the specific growth rate (1/t).
The specific growth rate is modelled considering two susbtrates, Glucose in the medium and Xylitol inside the cell, as follows:
There, [ Glucose] is the glucose concentration (g/l) and [ Xylitol] in is the xylitol concentration within the cell.
Parameter μGlcmax is the maximum specific rate on glucose alone and μXitmax is the maximum specific rate on xylitol; Ks,Glc and Ks,Xit are the Monod saturation constants for Glucose and Xylitol respectively and Kr is the repression constant by glucose.
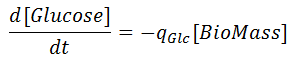
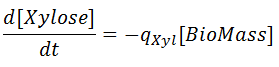
The rates for glucose and xylose uptake are related by the biomass concentration as:
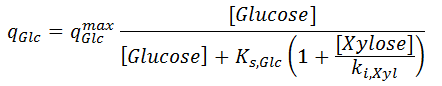
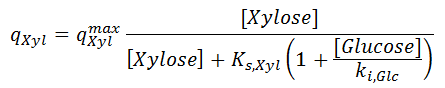
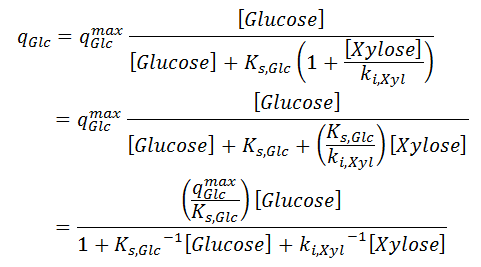
where the specific uptakes of glucose ( qGlc) and xylose ( qXyl) are expressed as follows:
There qGlcmax and qXylmax are the maximum uptake rates of glucose and xylose respectively; ki,Glc and ki,Xyl are parameters related to the inhibition for the uptake of one sugar with respect to the presence of the other. Saturation constant Ks,Glc is assumed to be same as in [ 2].
From the two last equations, you can see that the presence of glucose decreases the uptake of xylose, and the presence of xylose decreases the uptake of glucose, because the transport of those species through the cell membrane is facilitated by the same diffusion system.
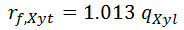
It is assumed that all xylose taken up from the medium is converted inside the cell to xylitol. Thus formation of intracellular xylitol is same as the uptake of xylose, adjusted by their ratio of molecular weight Mxylitol / Mxylose = (152.15 g/mol) / (150.13 g.mol) = 1.013. Given the specific uptake of Xylose from [ 6], the specific formation xylitol inside the cell is given by:
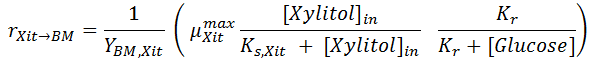
Some of the intracellular xylitol is used to create Biomass. The biomass yield on xylitol YBM,Xit thus tied the specific rates for biomass formation from xylitol (last term of Eq [ 2]) with respect to Xylitol consumption for cell formation:
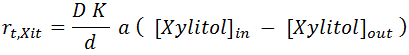
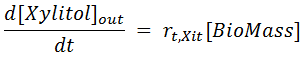
Intracellular Xylitol is also transported outside across the cell membrane. The proposed formulation from Tochampa et al. [ Ref 1] is estimated using a modification of Fick's law. The specific mass flux is proportional given by:
Where D is the diffusion coefficient of xylitol in the cell membrane, K is the partition coefficient, d is membrane thickness and a is the specific surface area of the cell.
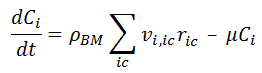
Thus, the Xylitol mass balance proposed by [ Ref 1] is actually twofold: a mass balance for Xylitol inside the cells and another for Xylitol in the medium (that is, outside the cells):
In the mass balance of xylitol inside the cell, ρBM is the mass density of the cell. The last term of [ 10] represents the dilution effect of the species inside the cells due to the increase of biomass. A derivation of this is shown later in this document.
The above equations represent the model presented by Tochampa et al. Please note that all the equations here deal with mass concentrations. REX works directly with mass balances, but we will replicate the same model above. The equivalence of the REX model to the equations above is explained in more detail here.
Basics of BioCell Modelling in REX
REX allows to model reactions that could take place either inside or outside the cells. Also, more than one cell type can be considered.
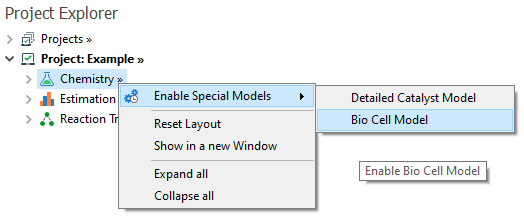
To enable this special model, you must go to the Chemistry node and right click on Enable Special Models → Bio Cell Model:
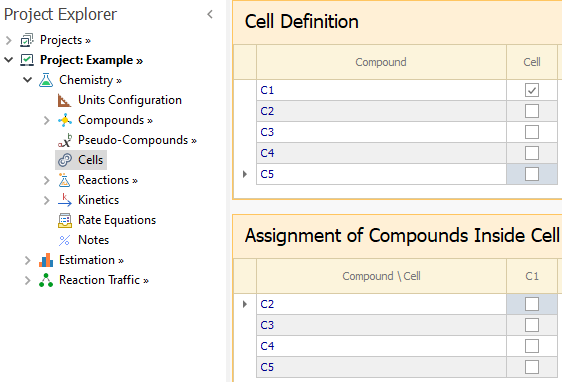
Once the Bio Cell model is enabled, the Cells node is shown in the Chemistry tree. In the first grid of that node, all compounds are listed and you must select which ones represent the cells.
Suppose we mark compound C1 as a Cell:
Then, in the second grid we can assign which compounds will be modelled inside the cell C1.
You can have more than one cell defined, but a given compound can not be assigned to more than one cell.
Once the intracellular and extracellular compounds are assigned, the concentrations are calculated accordingly. Considering Mass Density as the unit for Concentrations in Units Configurations node, we describe the concentration calculation for the different types of species below:
- Cells: The concentration for any compound selected as Cell is calculated as the usual way Mi / Vrph, where Mi is the mass of cells in the reactor and Vrph is the volume of the liquid reaction phase.
- Compounds assigned to Cells: Those compounds are assumed to be located inside a given cell, thus their concentration are referred to the cell volume: Mi / Vc, where Mi is the compound mass and Vc is the volume of the cell that he compound belongs to. The Cell volume is calculated through its density value that must be provided in the Chemistry → Compounds → Properties node.
- Compounds that are not Cells nor assigned to Cells: Those compounds are in the liquid solution outside the cells, thus its concentration is calculated with respect to the liquid phase volume, excluding the volume occupied by the cells themselves: Mi / [Vrph - Vc]. There, Mi is the mass of compound i in the liquid phase, Vrph is the volume of the liquid phase and Vc is the volume of the cell species.
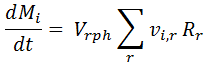
The mass balance equations used in REX are explained below. The equivalence between the REX model and the model in Tochampa et al is also described. In general, the mass balance for compound i for a pure batch reactor is given by:
Here, Mi is the total mass of compound i in the reactor, Vrph is the volume of the reaction phase, Rr is the rate for reaction r, and vi,r is the stoichiometry coefficient (mass basis) for compound i in reaction r.
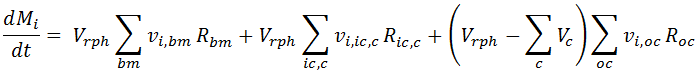
For Biocell models, the REX equations are formulated differently to account for both the cells and the extracellular medium. For a batch reactor without inflows or outflows, it is given by:
Here we implicitly discriminate among three types of reactions, modelled in the corresponding terms on the Right Hand Side (RHS) of the above equation:
- Biomass Reactions, indicated as by the bm subindex. These reactions are related to cell growth, and REX identifies them automatically: any reaction with a cell compound in its stoichiometry is assigned to this reaction type. The only exception is where a compound inside the cell it is also present in the reaction stoichiometry: for that case, the reaction is not considered in this reaction type but in the one described next.
In the batch mass balance above, they are taken into account in the first RHS term, where the reaction rate is multiplied by the liquid phase volume Vrph and by the stoichiometric coefficient vi,bm.
- Reactions taking place inside the Cell: Their rates are indicated by Ric,c in the second term of the above mass balance equation, where the subindex ic and c indicate that the reaction takes place inside the cell c. If a reaction stoichiometry has one or more compounds belonging inside a cell (identified in the Cells node), the REX internally assigns the reaction to this type. In the batch mass balance for compound i, the reaction rate is multiplied by the related stoichiometric coefficient of compound i and by the reaction phase volume Vrph.
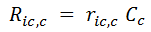
An important issue is that in REX we use Ric,c that has units of [Mass] / [Time] / [Volume of liquid phase]. However, it is common to refer to specific rate ric,c with units [Mass] / [Time] / [Mass of cells], as indicated in [1], [3] or [4]. The relationship between them is given by:
where Cc is the mass concentration of cell c in the reactor phase.
Thus, when implementing a literature model based on specific rates ric,c, we must add an order of one with respect to the cell to get Ric,c which is the rate type required in REX.
- Reactions taking place outside the Cells: Shown in the last term of the RHS of the mass balance above. There, Roc represents the reaction rate, that is multiplied by the stoichiometric coefficient and the liquid phase volume (Vrph minus the volume Vc taken by the cells c). REX identifies this reaction type when its stoichiometry does not have a cell or a compound inside the cell.
In this other example, we showed the equivalence between the model based on concentration derivatives and the REX internal model where derivatives for total mass of compounds is used. We extend that equivalence for the models above where intracellular compounds are considered.
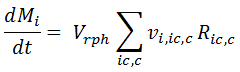
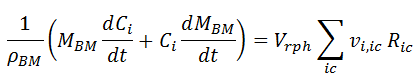
For a species i marked as belonging inside a cell, all reactions that contain this species are considered to take place inside the cell. Thus [ 13] simplifies to:
where Vrph is the reaction phase volume.
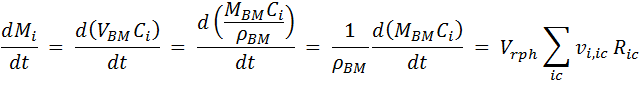
Simplification: Even if there are multiple cells defined in the project, compound i can only be assigned to one of them. From here on, we refer only to the cell to which the compound belongs and discard any reference to the other cells, so the index c on the summation can be dropped. We now express the mass of compound i as a function of its concentration inside the cell Ci and cell volume VBM. The latter is replaced by the ratio of MBM / ρBM (Cell mass / Density):
Applying the product rule for the differential:
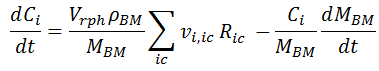
Solving for dCi / dt :
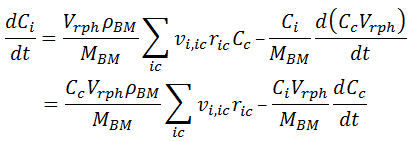
In the first term of the RHS, Ric,c is replaced by the specific rate ric,c, according to [ 14]. In the second term, we replace MBM in the derivative by the product of the reactor volume Vrph and the biomass concentration Cc. In addition, we assume constant reaction phase volume and take it out of the derivative:
In the first RHS term, Cc Vrph = MBM, so it get eliminated by the MBM in the denominator. In the second term, we replace Vrph / MBM, by Cc-1 :
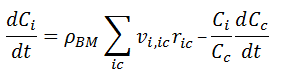
Replacing dCc / dt by [ 1], considering that [ Biomass] = Cc, we have:
This last formula is the general expression, from which [ 10] is the particular equation for Xylitol_in in this example.
The last term on the RHS takes into account the dilution of the compounds inside the biomass when it grows and is implicit in the REX model. The advantage of using Mass derivatives over Concentrations derivatives is that we need not assume constant reactor volume.
We now describe the model implementation in REX. You may import the Xylitol.rex file located in the Optience Corporation\REX Suite\REX Examples folder of your installation directory. You will see that the Biocell Model has been enabled in the Chemistry node. Units have been selected in accordance with the work of [ Ref 1], and Mass Density is chosen as the unit for Concentration.
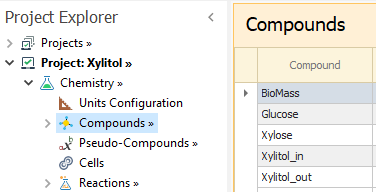
We enter the compounds. As we need to distinguish between the Xylitol inside and outside the cell, we load Xylitol_in and Xylitol_out as two compounds to track them individually:
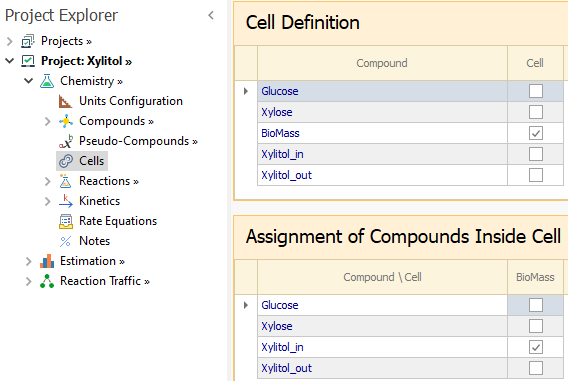
In the Cells node, BioMass is selected to represent the cell; Xylitol_in is the only compound we need to assign inside the cell:
Now we define the reactions in the system. For BioMass Growth, we need two reactions as the cell growth depends on Glucose and Xylitol reactants, according to equations [ 1] and [ 2].
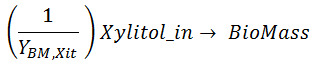
As seen from the model for Biomass formation from Xylitol_in (second RHS term of equation [ 2]) and the equation for xylitol_in consumption (equation [ 8]), we can tie these equations by defining this reaction:
The value of the YBM,Xit is unknown so it will estimated from the experimental data as in this other Example.
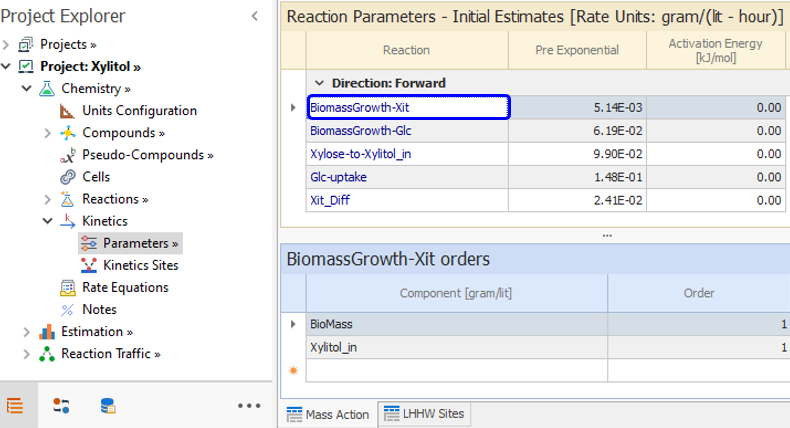
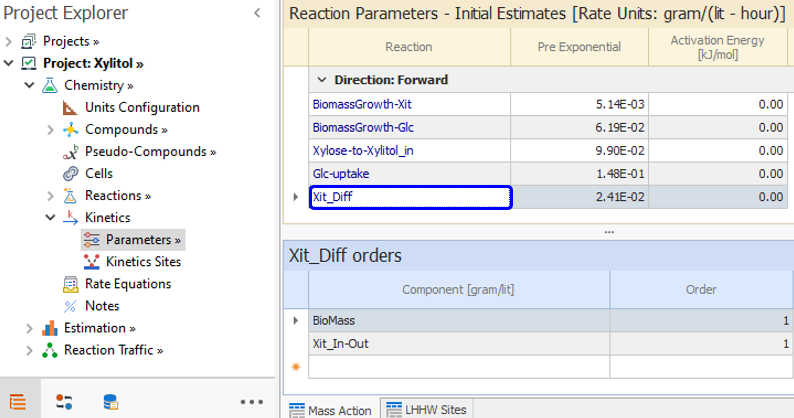
In the Parameters node, we set the orders of that reaction which according to [ 1] and [ 2] is one with respect to both BioMass and Xylitol_in.
We must now define the LHHW sites that account for the inhibitions indicated in [ 2]. You can inspect them in the Kinetics → Parameters node, where they are named InhBioMass-Xit and RepBioMass-Xit, and they are assigned to the BiomassGrowth-Xit reaction in node Kinetics → Kinetics Sites.
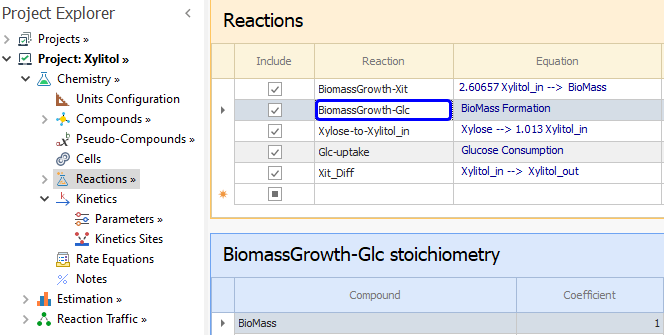
For glucose, the proposed model for conversion to biomass is not as direct. There is no simple proportionality constant between the equations for biomass growth from glucose ([ 1] and first RHS term of [ 2]) and the related model for glucose uptake (equations [ 3] and [ 5]). So a single reaction cannot model glucose to Biomass reaction as we could for the Xylitol to BioMass path.
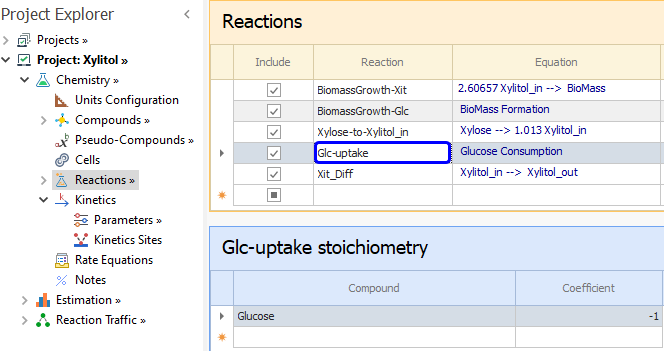
To address this, we define two reactions in REX: one where we enter BioMass as the only product and without any reactant, and another reaction with Glucose as reactant and no product. We will then use parameter relationships to tie the common parameters in these two reactions. The reaction definitions are shown below:
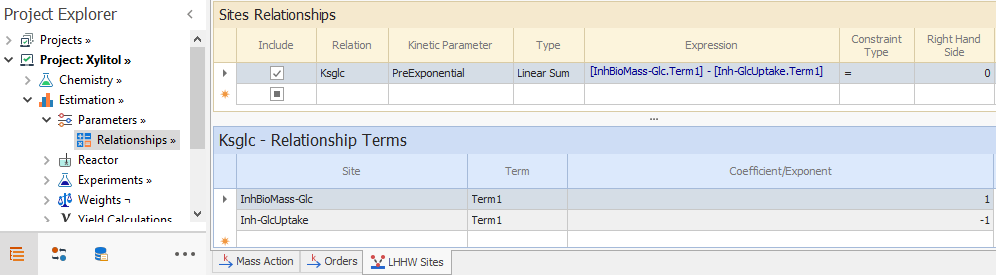
In the Kinetics → Parameters node, we enter the orders for these reactions, that are one with respect to Glucose and BioMass in both. Then we enter the inhibition sites for each reaction, in accordance with [ 2] and [ 5]. Parameter Ks,Glc in both reactions is same, so we need to enforce a parameter relationship. As we can enforce parameter relationship for Preexponentials and Energies but not for the site constant in Parameter Relationships node, we rearrange equation [ 5] so that:
Similar procedure is carried out for the inhibition of the first term in equation [ 2]. Thus, we can constrain the preexponentials of the glucose term of both sites in the Parameter Relationships node as shown below:
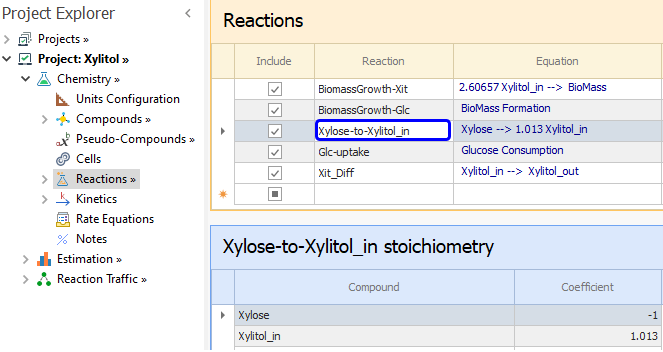
As for the Xylose conversion to Xylitol inside the cell, based on [ 7] we can enter this reaction:
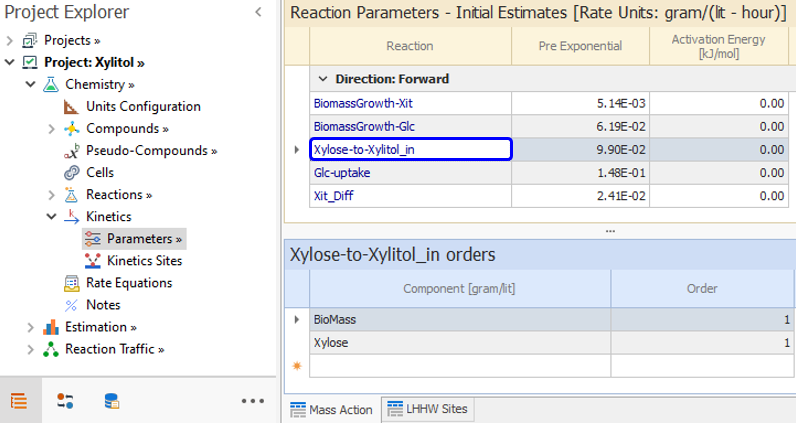
From equations [ 4] and [ 6], we enter order one with respect to Xylose and BioMass:
An LHHW Site is defined in Kinetics → Parameters node to account for the inhibition in [ 6] and assigned to this reaction in the Kinetics → Kinetics Sites node.
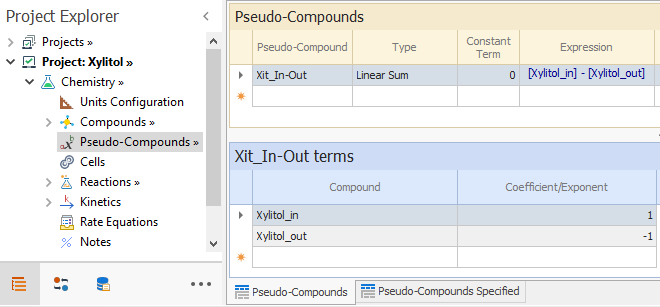
Finally, we have to model the diffusion of Xylitol through the cell membrane in accordance with [ 9]. We need to use an auxiliary variable to account for the concentration difference that is the driving force for diffusion. That is done by defining a PseudoCompound Xit_In-Out, as shown below:
The diffusion equation [ 9] is now modeled as a reaction Xit_Diff. The orders of that reaction are one with respect to the above mentioned pseudocompound and with respect to the biomass. This reaction has no inhibition factor:
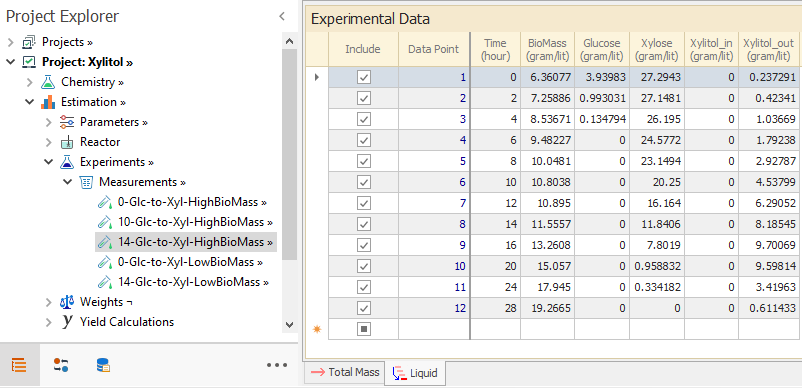
The experimental data from [ Ref 1] consists of concentration measurements for Glucose, Biomass, Xylitol and Xylose. The experiments combine sets with high and low initial Biomass concentration and 0, 7 and 14% of initial Glucose content. Measurements of Xylitol correspond to the concentration in the medium, so it is assigned to compound Xylitol_out. The experimental concentrations are entered in the phase tab of Measurements → Sets node:
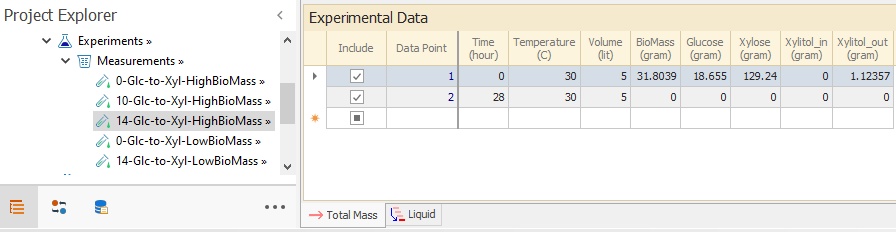
In the Total Mass tab, we need to specify the initial amount of each compound and we calculate that from the provided initial concentrations. Thus, the initial amount of BioMass is set to initial concentration multiplied by the volume. For the other species that are in the medium outside the cells, the calculation is done multiplying the initial concentration and the phase volume excluding the volume taken up by the Biomass at time=0.
We assume that there is zero amount of xylitol inside the cell at time=0. Thus, the Total Mass tab for a given set is entered as below:
The parameters that are estimated have open bounds in Estimation → Parameters node. The energies are not estimated (fixed to zero) because all experimental data is at same temperature. Not all LHHW Sites preexponentials are estimated in accordance with the model. Stoichiometric coefficients are only estimated for the xylitol to biomass reaction.
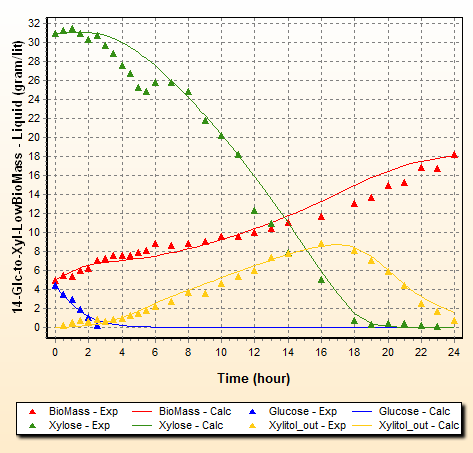
The results of the estimation can be seen in the Results tree. In particular, we show below the concentration predictions for a set with low biomass and 14% initial glucose:
You can see that Glucose is depleted early where it is converted to biomass. Interestingly enough, Xylose is also consumed but slowly during this initial stage because of glucose inhibition according to [ 6]. Xylose concentration actually increases a bit at the beginning due to low consumption while the volume of the medium is decreased by the formation of biomass. As Glucose concentration reduces, xylose consumption accelerates.
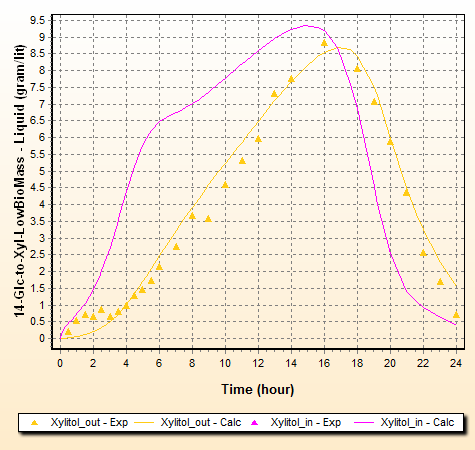
Xylitol is formed inside the cell and its concentration outside evolves as shown in the chart. However, when the Xylose concentrations become low, so does Xylitol formation. Thus, a maximum Xylitol concentration is reached in the medium. Xylitol diffuses back to the cell and xylitol consumption to yield biomass becomes the predominant reaction. In essence, the product Xylitol is lost to biomass formation. The chart below compares Xylitol concentration outside and inside the cell:
In the beginning, Xylitol inside the cell (pink line) increases fast as its consumption to produce biomass is inhibited by Glucose according to [ 8]. This increases the diffusion of Xylitol across the cell membrane and extracellular Xylitol concentration increases (yellow line) according to [ 9]. When Glucose is depleted, its inhibition on both the Xylose conversion to Xylitol ([ 6] and [ 7]) and the Xylitol conversion to BioMass [ 2] is gone. Rates of both Xylitol formation and consumption tends to accelerate as glucose inhibition is not present. However, as xylose reduces, conversion to xylitol becomes slower. External xylitol diffuses back to the cell and gets converted to biomass, thus explaining the xylitol maximum.
Even though the REX model above and the model of [ Ref 1] do a reasonable job of fitting the experimental data, the estimated kinetic parameters in these two models turned out to have substantial differences. The reasons for this could be manifold and a few of them are highlighted below:
- Sets used for estimation: All experimental data was used for estimation in REX, whereas only the first three sets were used in [Ref 1]
- Weighting factors: The hybrid weighting strategy used in REX is quite different from the method used in [Ref 1]
- Correlated Parameters and non-uniqueness: Given that both models are able to fit experimental data, parameter correlation could be a culprit. In LHHW systems, there is often strong correlation between the pre-exponentials for the numerator and denominator terms. Additional experiments or reformulation may be needed to get more unique estimates.
- Estimation solver: REX uses a gradient based (Generalized reduced gradient method) for the nonlinear estimation problem which is quite different from the genetic algorithm used in [Ref 1].
This example is a good reminder of the care needed in parameter estimation. Overparametrization can result in multiple parameter estimates giving an equally decent fit to the experimental data. Care should be taken in experiment design and the choice of model to get reliable estimates.
1. Tochampa, W., Sitisansaneeyakul, S., Vanichsriratana, W., Srinophakun, P., Bakker, H., Chisti, Y., A Model of Xylitol Production by the Yeast Candida Moguii, Bioprocess Biosyst Eng, 2005 (28), 175-183.
Go back to:
|